ECG's have many practical applications in medicine
24 hour holter monitor
portable ECG with limited electrodes that is used to detect irregular rhythms
Stress testing
done during exercise to look for electrocardiographic evidence of ischaemia leading to signs such as chest pain and angina
Portable ECG testing via phone devices and watches
Pacemakers & Defibrillators
detect abnormalities and deliver therapy PRN
Implantable loop recorders
can detect abnormalities but are unable to deliver therapy
N.B. ECG = Electrocardiogram = EKG in America
ECG's record the electrical activity of the heart that is transmitted to the surface of the body
depolarisation and repolarisation of the myocardium
causes changes in membrane potential that generate measurable current
Cells have a resting membrane potential of -90mV, meaning that at rest, the inside of the cell is negatively charged compared to the outside
Myocardial cells depolarise due to a Na+ influx allowing them to contract, causing the membrane potential to become less negative
This change in current is recorded in an ECG
Heart rate and rhythm
look for ischaemia
Segment = isoelectric (contains no wave forms)
Interval = isoelectric part plus one or more waves
Cardiac muscle action potentials are able to spread quickly through low-resistance gap junctions which connect adjacent cells
The respiration rate affects the heart rate
when you breathe in, the heart rate increases
when you breathe out, the heart rate decreases
Calculating the Heart Rate & Rhythm
There are two ways to calculate the heart rate using the rhythm strip, depending on the regularity of the rhythm
with irregular rhythms, the distance between QRS complex peaks will vary, so the first method is an inaccurate estimation of the heart rate
The normal paper speed of an ECG is 25mm/s
if the speed is changed, this will need to be taken into account in your calculations
e.g. paper speed of 50mm/s means that only 5 second rhythm strip being recorded
1) Regular Rhythms
Count the number of big boxes between the peaks of two QRS complexes
Divide 300 by this number
2) Irregular Rhythms
Count how many QRS complexes are on the 10 second rhythm strip
Multiply this number by 6
NB. 1 big box = 200ms, 5 big boxes = 1 second
Tachycardia = HR > 100bpm
Bradycardia = HR < 60bpm
Normal HR = 60-100 bpm
To report normal sinus rhythm, check that there is a P wave before each QRS complex and that the rhythm is regular
i.e. there is atrial depolarisation before there is ventricular depolarisation
Atrial fibrillation = HR that is irregularly irregular (no discernible pattern to the irregularity)
you will not see any discernible P waves because there are multiple foci that are rapidly depolarising in an irregular way, causing a chaotic fibrillary wave pattern
Normal PR interval = 120-200ms = 3-5 small squares
caused by the slowing of conduction by the AV node
Normal QRS duration = <120ms = 3 small squares
Normal QT interval = <440-450ms
shorter in women than men
The Cardiac Axis
The axis of the ECG just refers to the overall direction (a vector sum) of the electrical activity as it passes through the heart
When a current is moving towards a point, it causes a positive deflection in the waveform
Thus, if a peak is positive on an ECG tracing, this means that the current is travelling in the direction of that lead
When a current is moving away from a point, it causes a negative deflection in the waveform
If a current is moving past a point, it will initially cause a positive deflection and then will cause a negative deflection as it moves away
The 6 limb leads are made up of:
3 Bipolar leads: I, II and III
this means that the potential they are referencing is in relation to each other
Lead I = potential difference between right arm & left arm
Lead II= potential difference between right arm and left leg
Lead III = potential difference between left arm and left leg
3 Unipolar leads: aVR, aVL, aVF
this means that the potential they are referencing is in relation to a central point in the chest which is set to be at zero potential (Wilson's central terminal)
The triangular shape defined by the limb leads is known as Einthoven's Triangle
The 6 chest leads are all unipolar leads and the potential they are referencing is also set at the point of zero potential in the chest
The different leads calculated allow the localisation of pathologies within a 3D plane of the heart
The chest leads allow a transverse plane of the body plane to be visualised
The limb leads allow a horizontal plane of the body plane to be visualised
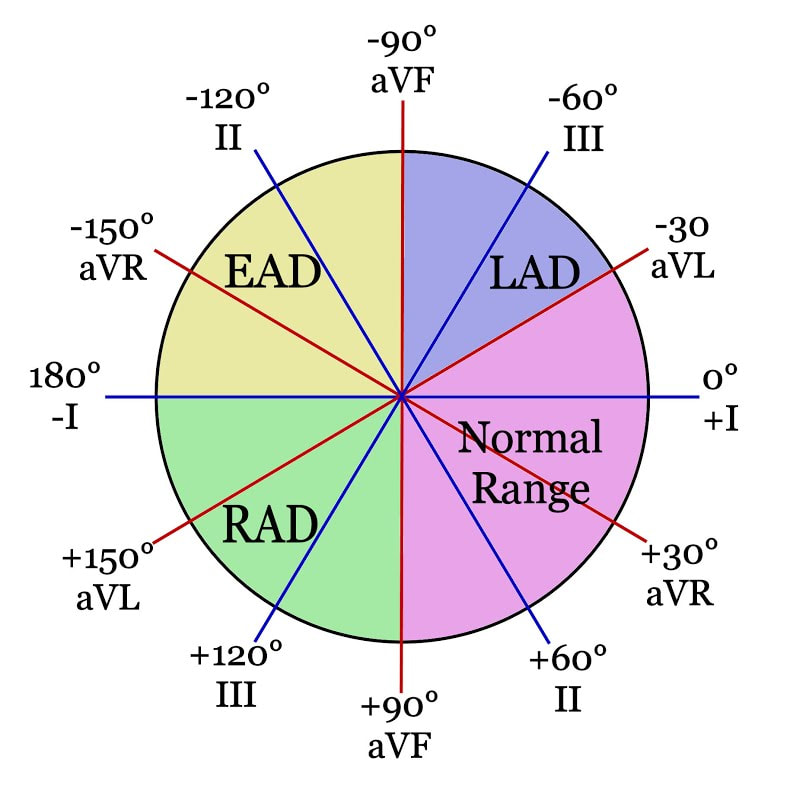
Calculating the Cardiac Axis
The best leads to start with are leads I and aVF
aVF should be positive along with lead I to ensure that the electrical activity is passing down towards the apex of the heart
The normal axis is usually positive in leads I, II and III
this is because the normal depolarisation of the heart passes from the sinoatrial node down to the apex of the heart, in the net direction of these leads
aVR should be negative as it points in the opposite direction to the normal axis
LAD = Left Axis Deviation
Lead I = positive, aVF = negative
e.g. left ventricular hypertrophy, left bundle branch/fascicular block
RAD = Right Axis Deviation
Lead I = negative, aVF = positive
e.g. right ventricular hypertrophy, RV strain due to pulmonary embolus
Amplitude Changes in an ECG
The normal amplitude of an ECG is calibrated to be 10mm/mV
Left Ventricular Hypertrophy will cause an increased amplitude in the direction of the left chest leads
to calculate this, you use the tallest amplitude wave
i.e. QRS complex in V5, V6 >35mm or aVL >11mm
S wave (downward direction) in V1 & aVR >35mm
Right Ventricular Hypertrophy causes an increased amplitude in the direction of the right chest leads
Lead V1 hugely positive
Lead I hygely negative
Other causes of amplitude changes:
chamber enlargement
ischaemia/fibrosis
electrolyte derangement
pericardial effusion (fluid acts as an insulator around the heart)
Bundle Branch Block
Due to delay in the left or right bundle branch conducting fibres
Depolarisation takes longer to occur, leading to a QRS complex that is wider
>0.12 seconds or >3 small boxes
Right Bundle Branch Block = slow conduction in the right bundle towards the right ventricle
this means that the left ventricle will contract slightly before the right
will see an overall broad QRS complex
in lead V1, you will see a "bunny ears" or M pattern where there are two peak waves
known as an RSR' (RSR prime) pattern where the R prime wave is dominant
In RBBB, the QRS complex in V1 will be markedly positive rather than negative
NB normal & common finding in about 14% of people
Left Bundle Branch Block = conduction in the left bundle to the left ventricle is slowed
QRS complex will be wide
V1 will still be negative (i.e. normal predominant S wave) but may be a W shape
Lead V6 will be an M shape
Atrial Hypertrophy
Affects the size and shape of the P-waves
In right atrial hypertrophy, the P wave is taller
In left atrial hypertrophy, there is a camel-hump P wave
Bradyarrhythmias and Pacemakers
Bradyarrhythmia is an abnormally slow heart rhythm where HR <60bpm
due to conduction abnormalities/disease in the heart
Bradyarrhythmias can be due to two pathologies:
Problems with the sinoatrial node
sinus node dysfunction, sick sinus syndrome
Problems with the AV node
AV node block, heart block
Sinus Node Dysfunction
Two causes:
sinus bradycardia (HR<60bpm)
sinus pause
sinoatrial block; depolarisations from the node cannot leave to depolarise the atria
sinus arrest; complete failure of depolarisation of the node
Sinus bradycardia
HR <60bpm
Sinoatrial block
intermittent blocking of some of the sinoatrial depolarisations from propagating to the atrium leads to a dropped atrial beat and thus a dropped P wave
pause duration is a multiple of the sinus rate (PP interval)
Sinus arrest
>3 second pause in activity is abnormal
another part of the heart will usually take over for the abnormal SA node which is not firing
Tachy-brady syndrome/post-reversion pause
AF, pauses and sinus beats all mixed in as a random pattern
heart block = slowed conduction through AV node due to a pathology of the AV node, leading to a prolonged PR interval
can be due to drugs, ischaemia, fibrotic tissue
digoxin, B-blockers, Calcium channel blockers slow conduction of the heart
1st, 2nd & 3rd degree heart block refers to the severity
1st = PR interval >200ms (1 big box)
normal PR interval is 120-200ms
delayed conduction through the AV node
does not require treatment
2nd degree has two types:
Mobitz I/Wenkebach AV block
PR interval gets more and more prolonged over successive beats until the heart skips a beat and there is a double P wave
Block at level of AV node
vagally mediated
can be physiological, especially in young athletes during sleep
Mobitz II
P waves march through at a constant rate without progressive prolongation but occasionally they will be non-conducted, i.e. not lead to a QRS complex
Infranodal block; will require permanent pacing as it is pathological
can lead to 3rd degree
3rd degree = complete heart block
no relationship between P wave and QRS complex because AV conduction not occurring
junctional/ventricular escape rhythm
P waves are still at regular intervals
usually causes bradycardia and requires a pacemaker
Symptoms of bradyarrhythmias include:
dizziness/lightheadedness, presyncope, syncope
presyncope and syncope most common as you get older
seizures
falls
can lead to traumatic injury
fatigue/lethargy
exertional SOB
organ failure due to hypoperfusion
Investigations for Bradyarrhythmia
ECG: looking at conduction intervals, bundle branch blocks